Reports & Analytics
Run the business from live numbers — not last month's Excel.
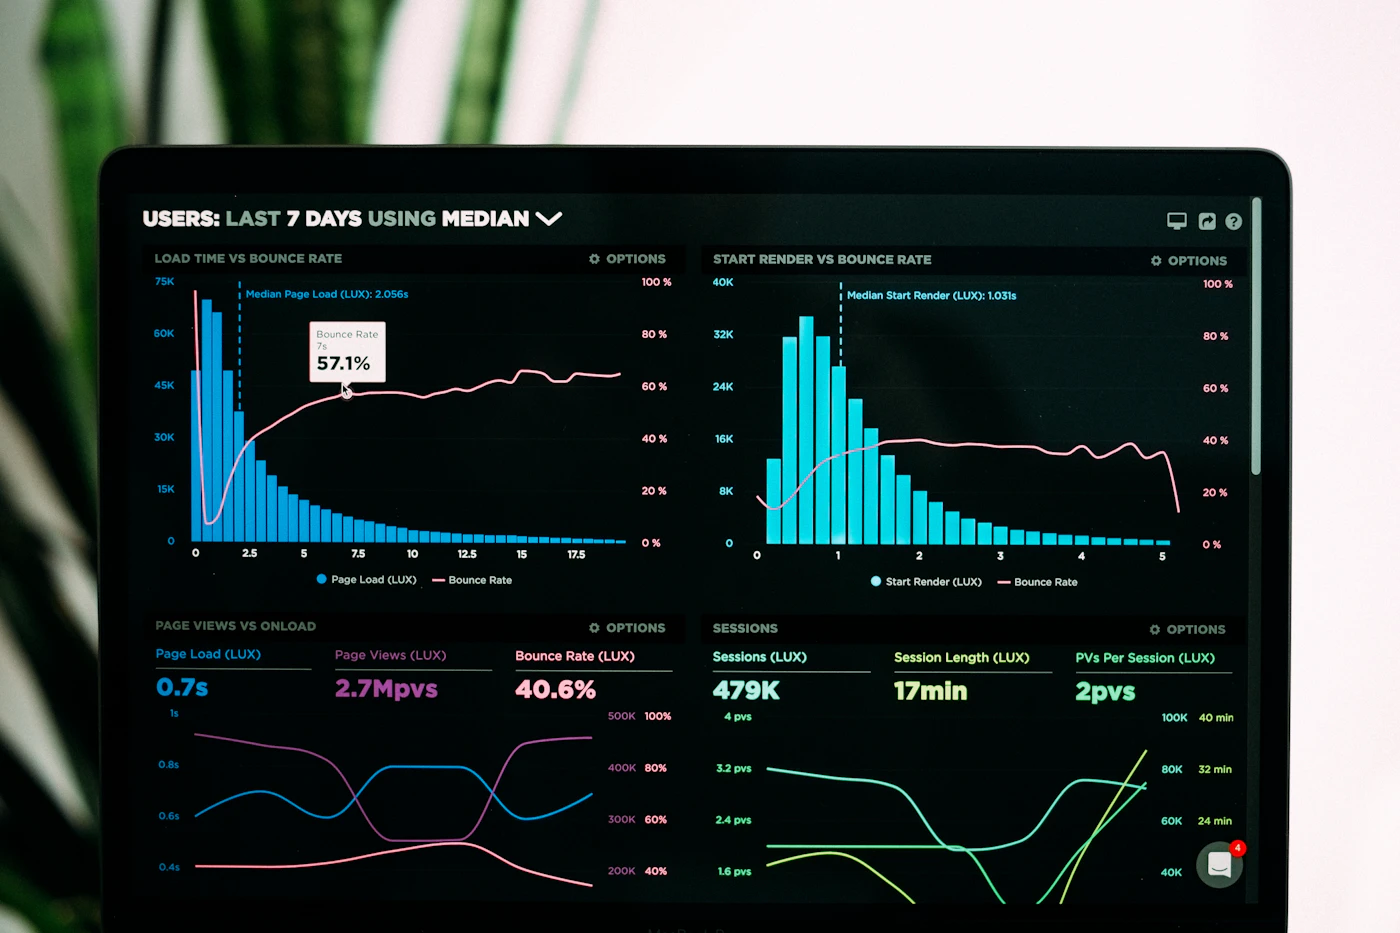
A unified analytics layer that pulls every transaction across CRM, quotations, production, inventory, procurement, and dispatch into role-specific dashboards — with drill-downs to the underlying record.
THE FLOW
How the work moves through the system
STEP BY STEP
Same flow, in plain language
- 1
Every operational transaction in the platform writes to a structured data layer — no ETL, no nightly batch.
- 2
Pre-built dashboards for each role (CEO overview, COO production, CFO cashflow, Sales Head pipeline) load on login.
- 3
KPI tiles surface the headline number; clicking drills into the chart, then into the transaction list, then into the individual record.
- 4
Custom reports are built with a drag-and-drop builder — no SQL required for analysts.
- 5
Filters by date, region, product line, customer, and vendor compose freely.
- 6
Reports schedule themselves to email on a cadence (Monday 8 AM weekly summary; first-of-month MIS pack).
- 7
Exports go to CSV, Excel, and PDF — the auditor and the board both stay happy.
WHAT YOU GET
Capabilities that ship with the module
Pre-built role dashboards
CEO, COO, CFO, and Sales Head each get a default that already answers their daily questions.
Drill-down to transaction
A surprise number on a chart is two clicks away from the underlying invoice or job card — disagreements end at the data.
Custom report builder
Analysts answer ad-hoc board questions without raising IT tickets — typical turnaround drops from days to minutes.
Scheduled email reports
Standing reports land in the right inboxes on cadence — no more "did anyone send the weekly?" Mondays.
Cross-module joins out of the box
Quote-to-cash funnel, scrap-to-vendor mapping, and similar cross-cuts are first-class — not a quarterly Excel project.
Audit-grade exports
CSV, Excel, and PDF outputs include filter context — auditors trust the lineage.
CONNECTS WITH
EXPLORE OTHER MODULES